In our previous article on portfolio construction we discussed several ways to measure the risk and return of investments. In this article, we'll expand on these concepts and discuss how to use them for the purpose of portfolio optimization.
In particular, we'll look at Markowitz portfolio optimization and the efficient frontier. This article is based on Week 2 of this Investment Management with Python and Machine Learning Specialization and is organized as follows:
- Asset Combinations
- Markowitz Optimization and the Efficient Frontier
- Using Quadratic Programming to Draw the Efficient Frontier
- Fund Separation Theorem and the Capital Market Line
Asset Combinations
To start, let's consider a simple example of the return and volatility of combining two assets: $A$ and $B$, with 50% of the portfolio in each.
The return of this asset allocation is simply the weighted average of the components of the portfolio:
$$R(w_A, w_B) = w_A * R_a + w_B * R_b$$
On the risk side, however, the volatility of the portfolio depends on the correlation between assets. Specifically, the less correlated each asset with one another the less volatile the portfolio will be.
Mathematically, we can express the volatility of two asset combinations as follows:
$$\sigma^2(w_a, w_b) = \sigma^2_A w^2_A + \sigma^2_B w^2_B + 2w_A w_B \sigma_A \sigma_B \rho_{A,B}$$
where:
- $\rho_{A,B}$ is the correlation between $A$ and $B$
The magic of diversification is that as you combine assets that are uncorrelated you end up with a portfolio that has a lower volatility than its underlying components.
Stay up to date with AI
Markowitz Optimization and the Efficient Frontier
As mentioned, if we have two uncorrelated assets that we're allocating capital to, we're able to lower the volatility of the portfolio.
If we add a third asset , we'll get a new potential risk and reward curve for the portfolio.
Every point on this curve corresponds to a particular portfolio of weights between the assets.
We can call a point on this curve $X$, which refers to an allocation of capital across $A$ and $B$. We can call the portfolio with a third asset $Y$.
If we think about $X$ and $Y$ as assets themselves, we can now build a portfolio that consists of some weight of $X$ and some weight $Y$.
In other words, we can define a new curve that represents all the portfolios we can build by allocating to $X$ and $Y$.
If we keep going with this, we can draw new curves from any point on the first curve to any point on the second curve. This means that by introducing a third asset, we now have an entire region of possible portfolios.
Each portfolio that we can build out of the three assets is a point within this region.
If we take a random portfolio $P$ within the region but below the curved line, this means that we should not invest in this portfolio.
The reason is that by simply choosing a portfolio straight up on the edge of the curve, call it $Q$, we can have a higher return for the same level of volatility. Similarly, we can also have a portfolio $R$ that has the same return with a lower volatility by going left to the edge of the curve.
The point is that you would never want to hold a portfolio within the interior region, as there would always exist at least two portfolios with a better risk/return.
In short, the only portfolios that a rational investor would want to choose are those that are on the edge of this frontier.
This is known as the efficient frontier.
As Investopedia defines:
The efficient frontier is the set of optimal portfolios that offer the highest expected return for a defined level of risk or the lowest risk for a given level of expected return.
Although this is a simple concept in theory, choosing a portfolio that is on the efficient frontier is much harder in practice.
It's important to note that there is actually only one portfolio on the efficient frontier, which is the one with the highest expected return and lowest volatility. We'll discuss this point in more detail below.

Using Quadratic Programming to Draw the Efficient Frontier
The efficient frontier is the space of portfolios that we may want to hold as they represent the highest return for the same level of volatility.
In this section, we'll look at how we can actually plot the efficient frontier. To do so, first we'll discuss the necessary theory and then put this into an optimizer that will tell us where the efficient frontier lies.
Convex Optimization to Draw the Efficient Frontier
Given a set of asset returns, volatilities, and correlations we can plot the efficient frontier.
We thus need to have expressions for the return and volatile of a portfolio.
The return part of a portfolio is simple—it is the weighted average of returns:
$$R_p = \sum^k_{i=1}w_i R_i$$
The expression for portfolio variance $\sigma^2$ is a generalization of the two asset formula we discussed above:
$$\sigma^2_p = \sum^k_{i=1}\sum^k_{j=1}w_i w_j \sigma_i \sigma_j \rho_{ij}$$
$$\sigma^2_p = \sum^k_{i=1}\sum^k_{j=1}w_i w_j \sigma_{ij}$$
We can improve on this notation by using a matrix form expression for portfolio return. To do so, we construct the weight vector $w$, which is a $k * 1$ vector of weights and $R$, which is the $k * 1$ vector of asset returns:
$$R_p = w^T R$$
Covariance Matrix
The covariance matrix is a symmetric square $k * k$ matrix where the $i$ and $j$ element is $\sigma_{ij}$ the covariance between $i$ and $j$ which is $\sigma_i \sigma_j \rho_{ij}$
Each diagonal element of $\sum$ is $\sigma_{ij} = \sigma_i \sigma_j \rho_{ij}$:
$$\sigma^2_p = w^T \sum w$$
Now we have the covariance matrix, the weight vector, and now we're trying to determine the plot of the efficient frontier.
From here, we want to take a portfolio that we already know lies on the efficient frontier, which is the asset with the lowest return. Since we know there's no way to get a lower return, we know that is is on the curve.
We then take the asset with the highest return as we know there's no way to get a higher return without using leverage.
With these two points on the curve we can then start building portfolios that lie between these two and run the optimizer to find the minimum possible variance portfolio for a certain level of return.
To do so, we take the space between the minimum and maximum return and split it into a grid. For every point on the grid we run the optimizer to find a set of weights that gives you a portfolio that minimizes the volatility for that level of return.
The expression for minimizing volatility comes from minimizing the variance, which is the same as minimizing half of $w^T$ $\sigma_w$:
$$Minimize : \frac{1}{2}w^T \sum_w$$
subject to:
- $w^T R = r_0$
- $w^T 1 = 1$
- $w \geq 0$
This expression is known as Quadratic Form, which is exactly the input that we want to use in a quadratic optimizer.
We provide a set of constraints and an objective function (minimize the variance) to the quadratic optimizer.
You can find the Python implementation for drawing the efficient frontier using quadratic programming in Week 2 of this course on Portfolio Construction and Analysis.
Fund Separation Theorem and the Capital Market Line
In this section, we'll discuss the concept of the Capital Market line, which can tell us something about the shape of the efficient frontier in the presence of a risk-free asset.
As Investopedia describes:
The capital market line (CML) represents portfolios that optimally combine risk and return.
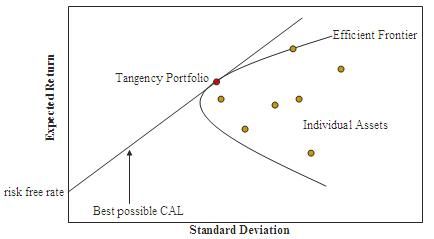
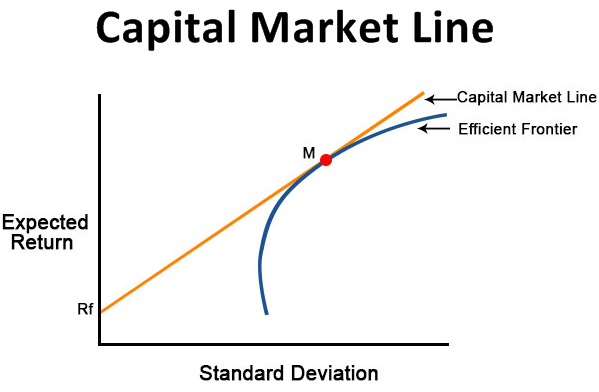
The key point to understand is that the efficient frontier dramatically changes shape when a risk-free asset is introduced.
Since we want to increase the return per unit of risk, what we are trying to do is maximize the slope of the tangency line, or the CML line.
In order to do so, we want to increase the CML line until it is at the tangency point with respect to the Markowitz Efficient Frontier made up of risky assets.
The name we give to the tangency portfolio is the maximum Sharpe ratio portfolio. Below you can see a visual representation of the capital market line:

Another important property of the maximum Sharpe ratio portfolio is that it can be shown that it contains no specific risk, only to system risk.
In short, the tangency portfolio is the portfolio that maximizes the sharpe ratio.
Mathematically, we can describe this as:
$$SR_p = \frac{mu_p - r_f}{\sigma_p}$$
where:
- $mu_p$ is the expected return of the portfolio
- $\sigma_p$ is the expected volatility of the portfolio
- $r_f$ is the risk-free rate
In summary, in the presence of a risk-free asset the efficient frontier becomes a straight line known as the capital market line.
Lack of Robustness of Markowitz Analysis
It's important to understand the pitfalls of using a Markowitz analysis, particularly the lack of robustness with respect to errors in estimating certain parameters.
Estimation error is always a key challenge in portfolio optimization.
This issue is particularly important when it comes to estimating expected returns.
There are various methodologies for improving estimates for expected returns and covariance parameters. In reality, however, there is always uncertainty, particularly for expected returns.
In practice, implementing Markowitz analysis often involves using the only portfolio on the efficient fronter that doesn't require an expected return parameter.
This portfolio is known as the global minimum variance portfolio.
The reason that this global minimum variance portfolio is so useful in practice is that we're trying to minimize variance without any expected return targets.
In summary, Markowitz analysis is very useful theoretically, although it is hardly used in practice since it tends to yield unreasonable corner solutions. This is due to the presence errors in parameter estimates.
As a result, portfolio managers tend to rely on portfolio construction methodologies that don't rely on expected return estimates, such as the global minimum variance portfolio.


