In our previous guide on GPT-4 for finance, we've explored several applications of Large Language Models (LLMs) for finance such as summarizing earnings call transcripts, stock screening assistants, and more.
In this guide, we'll expand on our previous guide on GPT-4 for financial statements, except in this guide we'll focus on analyzing financial ratios.
The financial ratios assistant will retrieve ratios for a particular stock, summarize them for the time period selected, and then provide further analysis of data.
You can upload and analyze your own data & documents with prebuilt workflows. The agent also has access to to 10+ years of financial data, company news, financial statements, key metrics, earnings calls, and more.
Try it out for yourself here.
We'll also build a simple frontend using Streamlit that allows users to select the chosen ticker, the period (i.e. annual or TTM), and the number of past statements
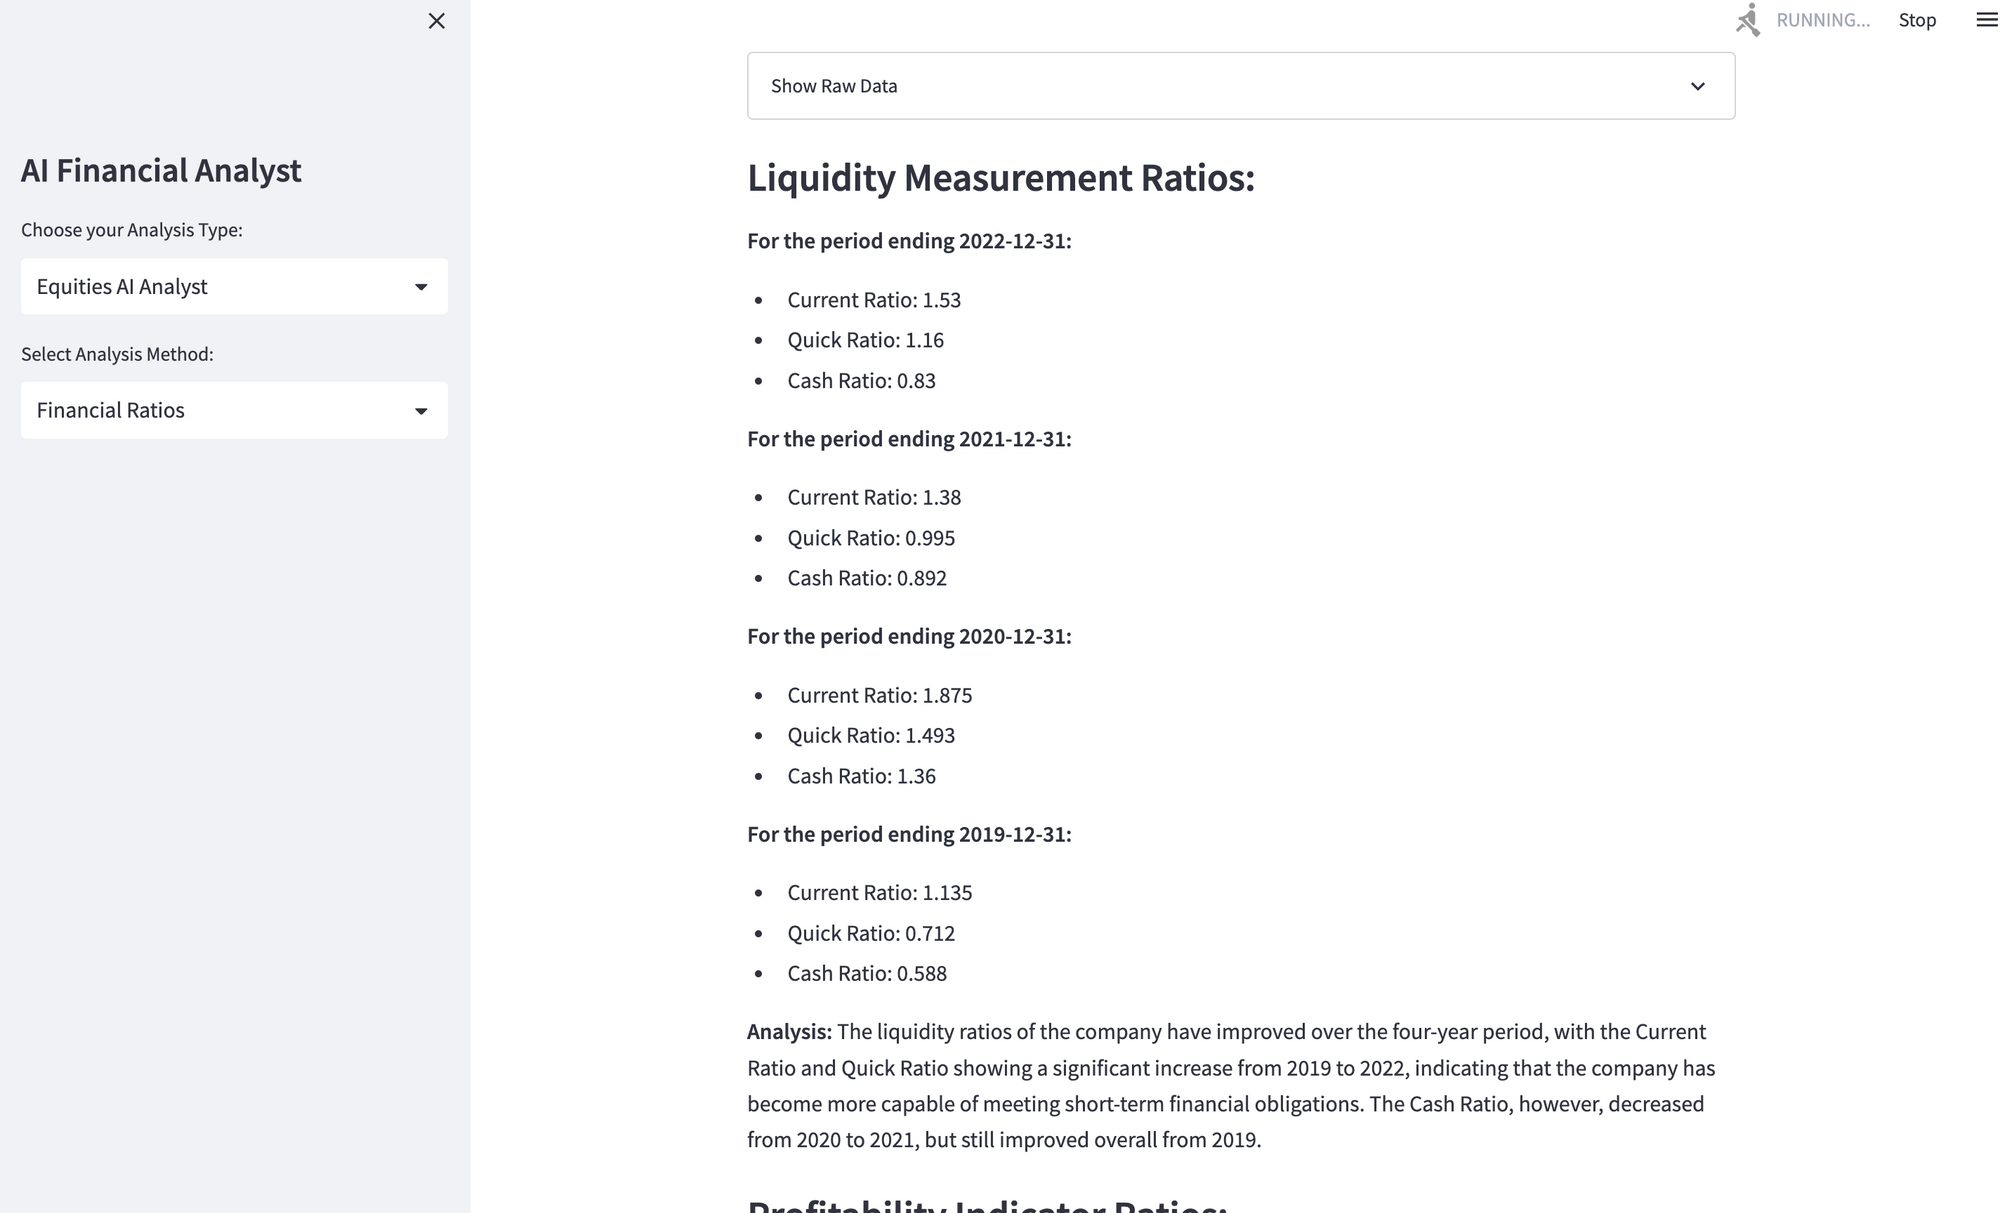
The Streamlit app will first return a pandas DataFrame of the financial ratios so the use can confirm all the numbers, and will then summarize each ratio out into the following categories:
| Category | Ratio |
|---|---|
| Liquidity Measurement Ratios | Current Ratio |
| Quick Ratio | |
| Cash Ratio | |
| Profitability Indicator Ratios | Gross Profit Margin |
| Operating Profit Margin | |
| Net Profit Margin | |
| Debt Ratios | Debt Ratio |
| Debt to Equity Ratio (D/E Ratio) | |
| Operating Performance Ratios | Asset Turnover |
| Fixed Asset Turnover | |
| Cash Flow Indicator Ratios | Operating Cash Flow per Share |
| Free Cash Flow per Share | |
| Investment Valuation Ratios | Price-Earnings Ratio (PE Ratio) |
| Price-to-Book Ratio (PB Ratio) | |
| Dividend Yield |
As you can see below, by using GPT-4 to summarize financial data and perform some basic financial analysis, we can highlight important changes over the time period that may have otherwise been overlooked.


Alright now that we know what we're building, let's jump into the code.
Step 0: Installs & Imports
First, you'll need to install the following libraries with pip:
pip install streamlit openai
Next, let's import the following libraries into our app.py and set our set our OpenAI and Financial Modeling Prep API keys in apikey.py
import streamlit as st
import openai
import pandas as pd
import requests
from apikey import OPENAI_API_KEY, FMP_API_KEY
openai.api_key = OPENAI_API_KEY
Step 1: Retrieving Financial Ratios
Next, we need to create a function to retrieve financial ratios from the Financial Modeling Prep API.
Here, the get_financial_ratios() function takes in the company's ticker, the number of past periods to retrieve (limit), and the period (i.e. annual, quarterly, or trailing twelve months TTM)
Since the API call for TTM is slightly different than annual and quarterly, we'll just write an if statement to check if the period is TTM we use ratios-ttm URL, if not use the ratios URL:
def get_financial_ratios(ticker, limit, period):
    if period == 'ttm':
        url = f"https://financialmodelingprep.com/api/v3/ratios-ttm/{ticker}?apikey={FMP_API_KEY}"
    else:
        url = f"https://financialmodelingprep.com/api/v3/ratios/{ticker}?period={period}&limit={limit}&apikey={FMP_API_KEY}"
    data = get_jsonparsed_data(url)

    if isinstance(data, list) and data:
        return pd.DataFrame(data)
    else:
        st.error("Unable to fetch financial ratios. Please ensure the ticker is correct and try again.")
        return pd.DataFrame()
We'll also create the get_jsonparsed_data() helper function to send a GET request to the provided URL and parse the JSON response:
def get_jsonparsed_data(url):
    response = requests.get(url)
    data = response.json()
    return data
Step 2: Generate Financial Ratios Summary with GPT-4
Next, in order to make these financial ratios a bit more readable, we'll first generate a textual summary of each ratio and then feed those summaries into GPT-4 for further analysis.
Generating Financial Ratio Summaries
Here, the generate_ratios_summary takes as input:
- The pandas DataFrame containing financial ratios (
financial_ratios) - The time period selected (annual, quarterly, or trailing twelve months (
period) - and a Streamlit placeholder (
placeholder_response), which we'll use late to dynamically stream the AI response
The function starts by creating an empty list summaries[] to store generated ratio summaries. It then loops through each time period in the input DataFrame, and each generated summary is added to the summaries[] list.
Once all summaries are generated, they are combined into a single string all_summaries using the join() function.
def generate_ratios_summary(financial_ratios, period, placeholder_response):
    summaries = []
    for i in range(len(financial_ratios)):
        if period == 'ttm':
            period_info = 'For the trailing twelve months'
        else:
            period_info = f"For the period ending {financial_ratios['date'][i]}"

        summary = f"""
            {period_info}, the company reported the following key ratios:

            Liquidity Measurement Ratios:
            - Current Ratio: {financial_ratios['currentRatioTTM'][i] if period == 'ttm' else financial_ratios['currentRatio'][i]}
            - Quick Ratio: {financial_ratios['quickRatioTTM'][i] if period == 'ttm' else financial_ratios['quickRatio'][i]}
            - Cash Ratio: {financial_ratios['cashRatioTTM'][i] if period == 'ttm' else financial_ratios['cashRatio'][i]}

            Profitability Indicator Ratios:
            ...

            Debt Ratios:
            ...

            Operating Performance Ratios:
            ...

            Cash Flow Indicator Ratios:
            ...

            Investment Valuation Ratios:
           ...
            """
        summaries.append(summary)

    # Combine all summaries into a single string
    all_summaries = "\n\n".join(summaries)
Using GPT-4 for further analysis
Now that we've got all the summaries in a logical textual format, let's feed these into GPT-4 with the openai.ChatCompletion.create() method.
As the OpenAI documentation highlgihts:
Chat models take a series of messages as input, and return a model-generated message as output.
The main input is the messages parameter. Messages must be an array of message objects, where each object has a role (either "system", "user", or "assistant") and content (the content of the message). Conversations can be as short as 1 message or fill many pages.
In this case, we're instructing the system message You are an AI trained to provide financial analysis based on financial ratios. and the user message is...
Please analyze the following data and provide insights:\n{all_summaries}.\nFormat each section as instructed in the summary section and then provide analysis of how the ratios have changed over the time period.We're also going to add streaming to the response by chunking the assistant_reponse, setting stream=True in our GPT-4 API call, and displaying the response in Streamlit using the placeholder placeholder_response.
 Call GPT-4 for analysis
    response = openai.ChatCompletion.create(
        model="gpt-4",
        messages=[
            {
                "role": "system",
                "content": "You are an AI trained to provide financial analysis based on financial ratios.",
            },
            {
                "role": "user",
                "content": f"""
                Please analyze the following data and provide insights:\n{all_summaries}.\n
                Format each section as instructed in the summary section and then provide analysis of how the ratios have changed over the time period. Please write the ratios is markdown format.

                Note:
                - Use human-friendly formats like 'billion' or 'million' instead of scientific notation or large numbers of digits.
                - If you need to use the dollar sign in your response, please escape it by preceding it with a backslash (\$) to avoid formatting issues.
                """
            }
        ],
        stream=True
    )

    # Display the response
    assistant_response = ""
    for chunk in response:
        if "role" in chunk["choices"][0]["delta"]:
            continue
        elif "content" in chunk["choices"][0]["delta"]:
            r_text = chunk["choices"][0]["delta"]["content"]
            assistant_response += r_text
            placeholder_response.markdown(assistant_response, unsafe_allow_html=True)

    return assistant_response
Step 3: Building the Streamlit App
Lastltly, let's define a function called financial_ratios, which contains the frontend Streamlit code to interact with the GPT-4 financial ratios assistant.
Here's a breakdown of the function
- We set the title of the app with
st.title('GPT-4 & Financial Ratios') - We create two columns to display the
periodandlimitinputs, and another input section for theticker - If the Run button is clicked, the function checks if the ticker field isn't empty and converts the input to uppercase
- The
get_financial_ratios ()is then called with theticker, limit, periodas inputs - If the
financial_ratiosdataframe is not empty, we then call thegenerate_ratios_summary()function - With
st.expanderwe first show the raw financial dataframe - We then create an empty slot in the app for
placeholder_response = st.empty()and display the streamingfinancial_ratios_analysisin markdown generated from thegenerate_ratios_summaryfunction
def financial_ratios():
    st.title('GPT-4 & Financial Ratios')

    # Create two columns
    col1, col2 = st.columns(2)

    with col1:
        period = st.selectbox("Please select the period:", options=["Annual", "Quarter", "TTM"])
    with col2:
        limit = st.number_input("Number of past financial ratios to analyze:", min_value=1, max_value=10, value=4)

    ticker = st.text_input("Please enter the company ticker:")

    if st.button('Run'):
        if ticker:
            # Convert ticker to uppercase
            ticker = ticker.upper()

            # Get financial ratios
            financial_ratios = get_financial_ratios(ticker, limit, period)
            # Display DataFrame with st.expander
            with st.expander("Show Raw Data"):
                st.dataframe(financial_ratios)

            # Generate GPT-4 Analysis
            if not financial_ratios.empty:
                financial_ratios_analysis = generate_ratios_summary(financial_ratios, period)
                st.markdown(financial_ratios_analysis)
            else:
                st.warning('Please enter a valid ticker and click "Run" to fetch the financial ratios.')
        else:
            st.warning('Please enter a valid ticker and click "Run" to fetch the financial ratios.')
With this, all we need is a main function to run the app as follows:
def main():
    st.sidebar.title('AI Financial Analyst')
    mode = st.sidebar.selectbox("Choose your Analysis Type:", ["Financial Statements", "Financial Ratios"])
    if mode == 'Financial Statements':
        financial_statements()
    if mode == 'Financial Ratios':
        financial_ratios()

if __name__ == '__main__':
    main()
Now we have everything we need to run the app locally with streamlit run app.py.
Summary: GPT-4 for Financial Ratios
In this guide we saw how we can use GPT-4 to summarize and analyze financial ratios is a significantly more user-friendly format that simply displaying the data in a standard table format, like the majority of data providers do.
While this is a decent starting point, to make this truly interactive, over the next few articles we'll discuss how we can expand on this with a chat component so the user can ask follow up questions about the data.
With a chat and memory component, this will empower users to explore data in a way that's much more suited to their unique needs, getting us one step closer to creating an end-to-end AI financial analyst.


